
In previous posts, I outlined an old habit of periodically taking a look at how the various Government Bond Yield Curves had changed over time.
Quick to stress though that I view the changes now Systematicaly, purely as a statement of Price/Yield movements, avoiding any interpretation of "fundamental economic" mumbo jumbo that others in their wisdom may apply by way of explanation or justification.
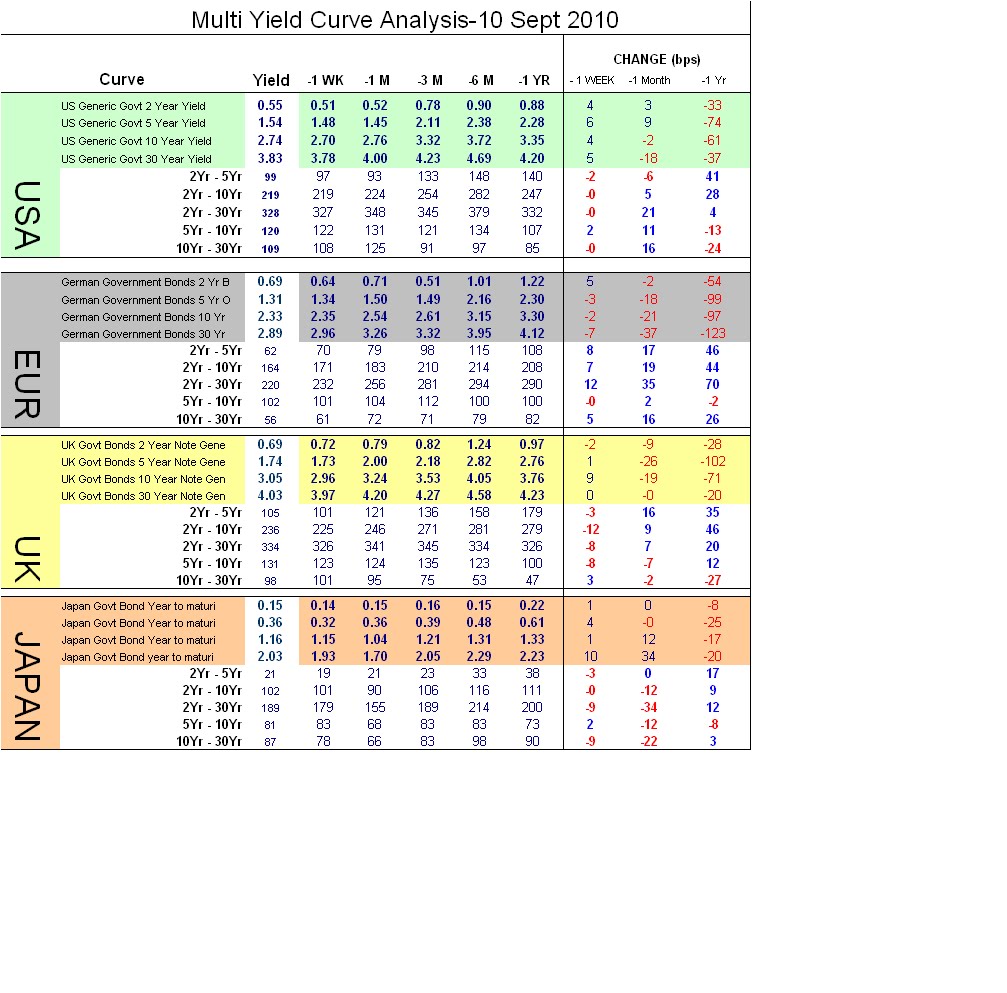
Fig 1: shows German Govt 10 yr yields rising +33 bps from last weeks low of nearly 2% and the Bund future falling from 133.38 to 130.28, I thought it a good time to Post the latest breakdown of which segments of each Curve had changed and by how much
Fig2 below also shows one of our Trading models and historic trading Signals on the 2yr versus 10 yr part of the Eur Curve showing the "Flattening" ( -2's +10's ) duration weighted signal on the 24 May at -218 bps , currently -163 bps.
Interpret as you will
Enjoy
 |
| [Click to enlarge] |
Fig:2 Eur 2's v 10's Flattening
 |
| [Click to enlarge] |
No comments:
Post a Comment