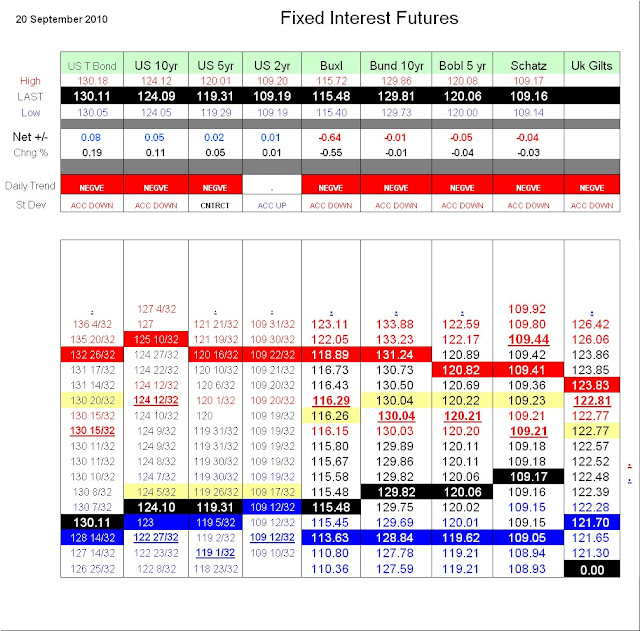
For an explanation of how these numbers are derived see Introdiction to Std Deviation price Tables, Post 9 Sept.
Key
Black - Last Price at posting
Yellow - Daily Pivot. Price above "Bullish" and indicative of recent rising prices. Price below "Bearish" and indicative of recent falling prices
Blue - Prices Oversold and should experience some Reversion to Mean
Red - Prices Overbought and should experience some Reversion to Mean
Daily Trend: Posve/Negve/Neutral
Std Dev - measure of internal Daily Trend/Momentum strength (Accelerating Up/Down/Contracting
Enjoy


No comments:
Post a Comment